 Disruptive Proactivity
Cambridge House Prices (over time)
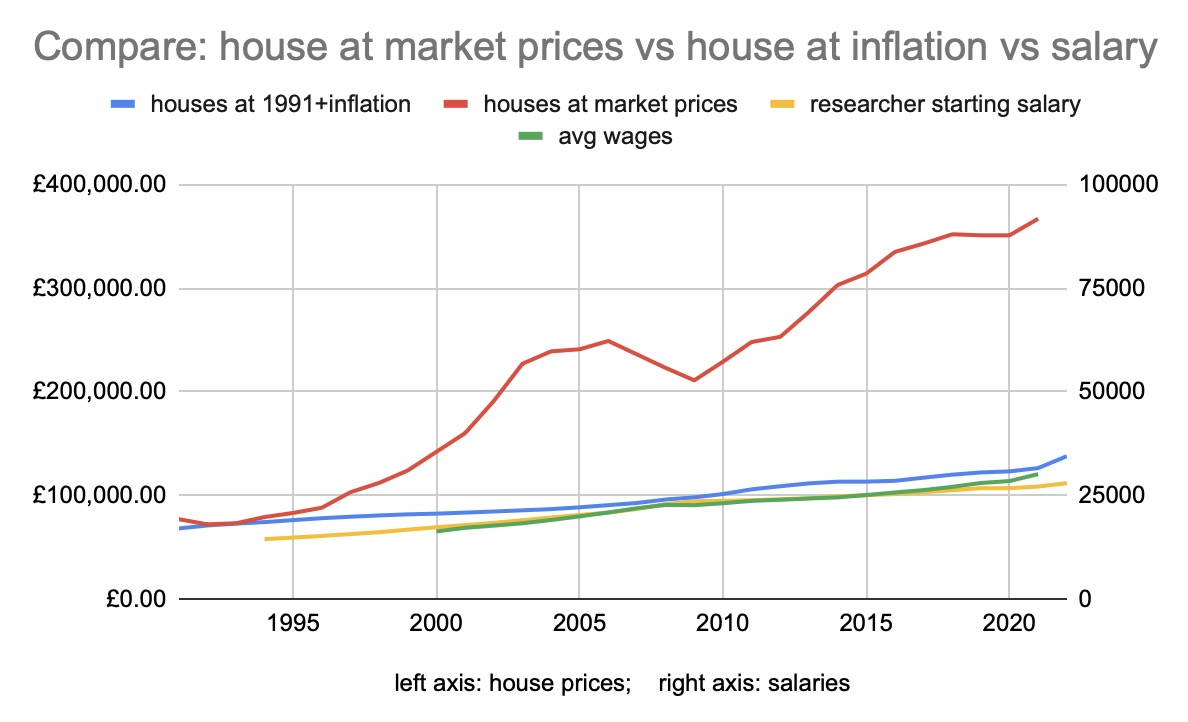
“Sustainable” housing prices for Cambridge would be a band D house costing around £150k in 2022.
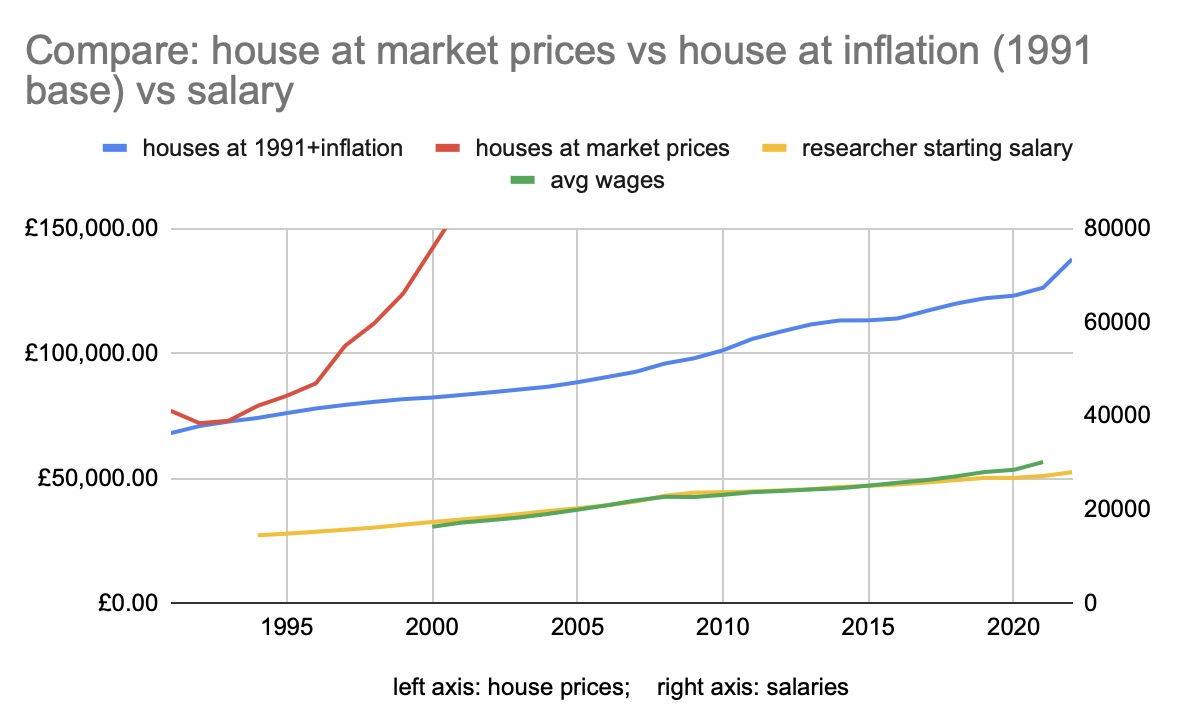
Some data on Cambridge house prices as they grew, compared to 1991 prices with inflation, and starting salaries of cambridge researchers, and Cambridge averages (posted largely so I can find them again)
Anything that is unsustainable will eventually stop, but it is currently entirely sustainable because we are still doing it…. for now?
August 2023: The Cambridge Bennett Institute has now run some similar numbers over a short time period.
Notes
- Why start the graphs in 1991? Council Tax (Band D based) still uses that…
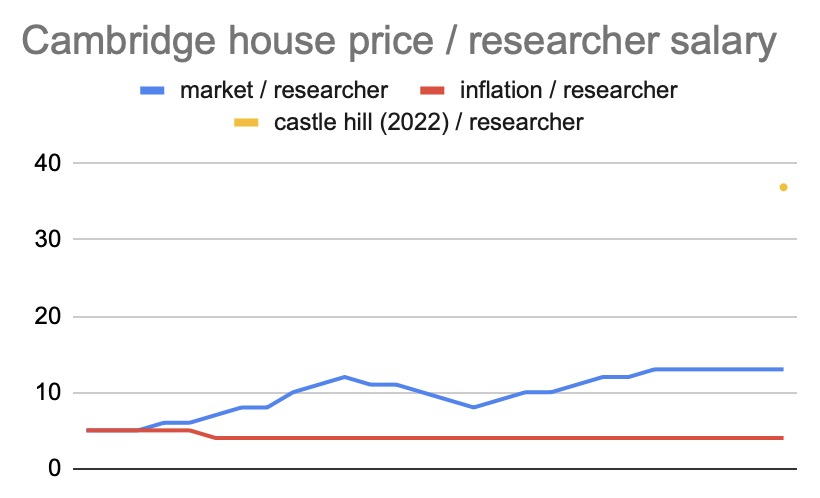
- Actual house prices are even higher than shown – the Band-D £68k house in 1991 is now the yellow £1m dot in the Castle Hill neighbourhood I picked.
- Historic researcher salary data is less tidy (started from 2022 starting salary, matching well back to ~2001, a bit wobbly a bit earlier)
- I’ve not seen good historic salary data for gardeners (or porters) in Cambridge going back to 1991. If someone wants to extend any data back earlier, I’m happy to add years into the spreadsheet